Shipments
They Can Only Get Better from Here
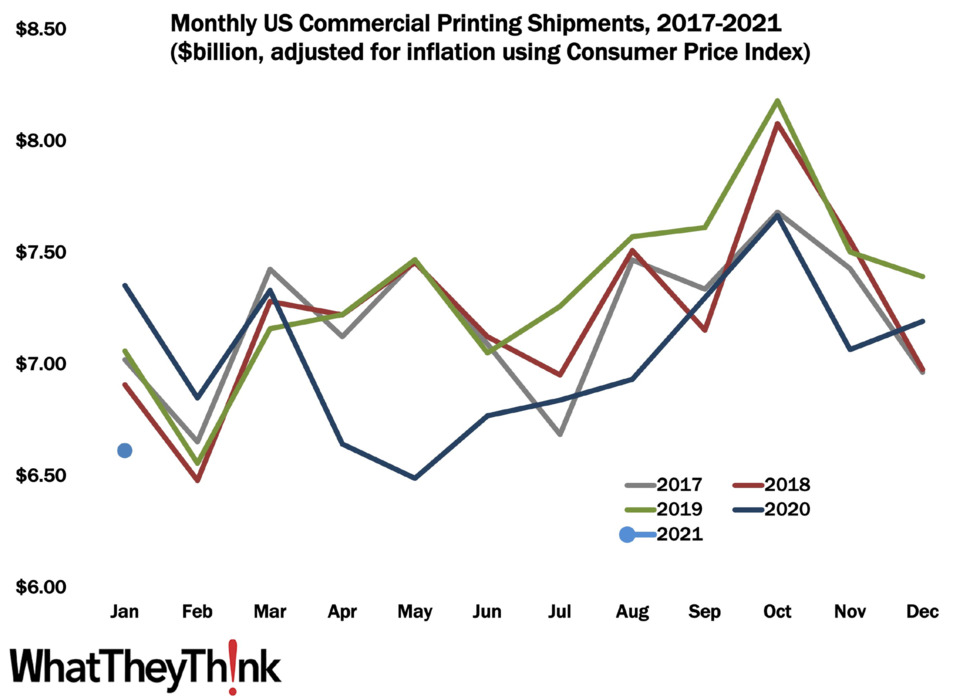
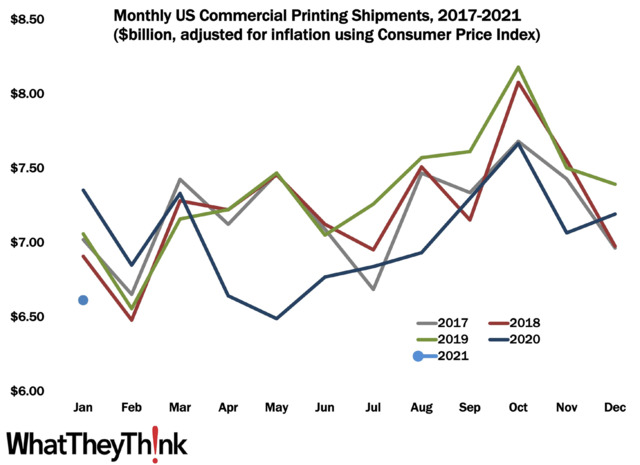
Well, we certainly didn’t kick off 2021 very auspiciously, with January printing shipments coming in at $6.61 billion, down from 2020’s $7.17 billion. On the plus side, this is actually kind of normal: January shipments are usually down from December, the only exception being December 2019 to January 2021, where shipments stayed virtually the same. So if this is any indication, we may be reverting to the usual industry seasonality. At last! Something like normalcy.
However, on the minus side, it is the worst January in at least the last five years, and if we are reverting back to our regular seasonality, February numbers are not going to be good.
That said, we are probably not looking at our usual seasonality. December had been a heady month shipments-wise, and this is likely a slowdown from holiday print work. Usually the holiday impact on industry shipments occurs a month or two earlier but what’s even usual anymore? At the same time, The COVID Factor (which sounds like the title of a Robert Ludlum novel) is still in effect, and a lot of businesses that could stay relatively open in the fall had no choice but to close—outdoor dining is fine when it’s in the 50s and 60s but in the Northeast, for example, where temperatures had been below freezing (or even 0) for most of January and February, firepits and heatlamps are not gonna make outdoor dining pleasant.
And we all know very well that events are still verboten. As of this writing, some states are planning to ease (some slightly, some a lot, some unwisely) opening restrictions and while winter has been tough, things are looking better as we move toward spring—and vaccinations. We expect the next one or two shipments reports to be on the bleak side, but we will likely start to see things improve by about the one-year anniversary of the pandemic.
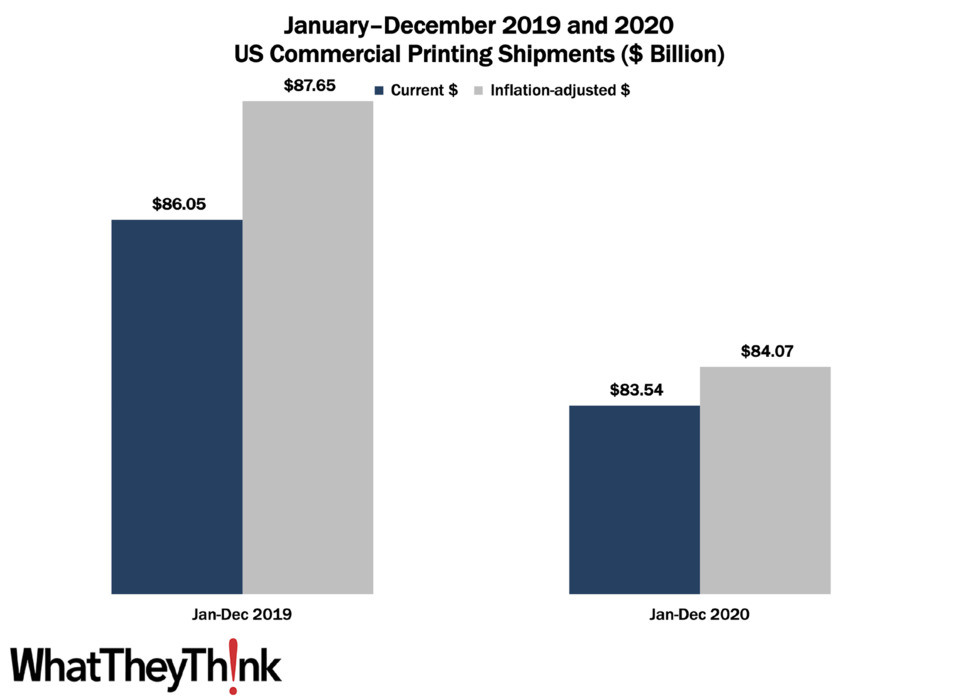
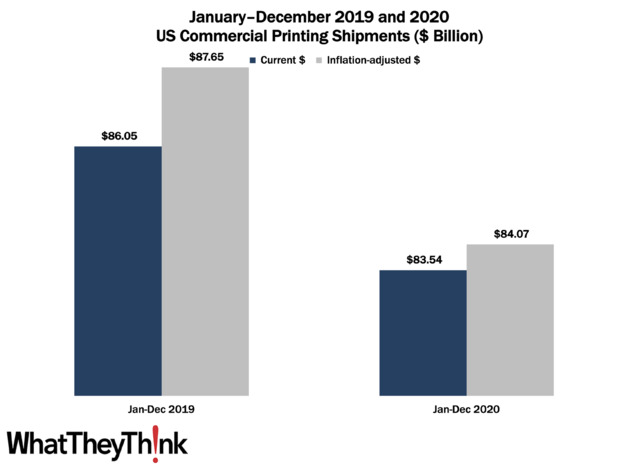
Looking back at 2020 (should anyone want to do that), we ended up with 2020 being an $84.07 billion year, down from $87.65 billion in 2019. When you consider all that happened in 2020, it’s hard to be completely disappointed—and a year ago at this time it was inconceivable that 2020 would come in only $3.6 billion off 2019 shipments.
Profits: Back to the Tale of Two Cities
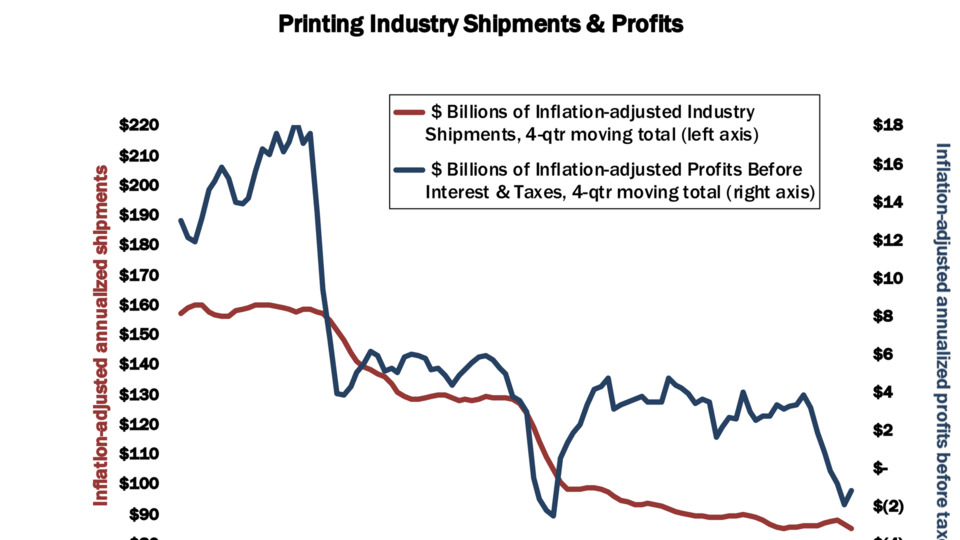
We’ve long been calling it “a tale of two cities”—large printers and small/mid-size printers and the profitability gap between them. The pandemic interrupted this ongoing narrative temporarily, but in the latest (Q3 2020) profits report, we are back to normal, at least in terms of industry profits trends.
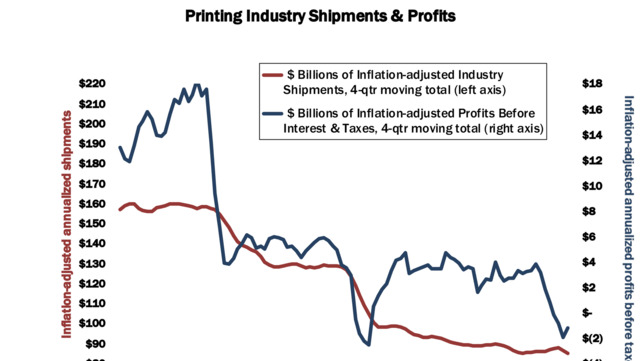
As we saw, shipments-wise, we had been having a pretty OK third quarter (things didn’t go south until November) and that actually translated into a rise in profitability. Annualized profits for Q3 2020 rose from -$1.92 billion to -$1.19 billion. That’s still really low, but at least it’s headed back toward positive territory, although given shipments for November and likely December, we may see another drop in Q4 profits. This isn’t all pandemic-related; Q4 2019 profits had plunged from Q3, and this was before almost anyone had ever heard the term “coronavirus.” There is some comfort (cold though it may be) in seeing that the drop from Q1 to Q2 2020 simply was the continuation of a trend that had already been going on for a few quarters.
In Q3, we resume our “tale of two cities” saga. For large printers (those with more than $25 million in assets), profits before taxes had been -1.71% of revenues, an improvement from Q2, where profits had been -6.95% of revenues. But for small printers, profits before taxes in Q3 were +8.81% of revenues, a vast improvement over Q2, where profits had been -1.70% of revenues. Q2 had interrupted our “tale of two cities” narrative a little—big printers did a little better profitwise, while small printers did a lot worse—but Q3 sees a regression to the mean. For the industry on average, profits before taxes were +2.42% of revenues, and for the last six quarters, they’ve averaged -1.08% of revenues.
So back in Q2 we couldn’t really blame the large printers for driving down overall industry profitability, but that was only a short reprieve. Interestingly, it may have been one positive side benefit of the pandemic. But, as with shipments, the impact of the pandemic on profits hasn’t been insignificant, but has been a little muted; we had been expecting the Q2 report to be a lot worse, although the Q3 report was about what we had expected given what we had seen with shipments.
This Macro Moment: Tracking the Recovery
In the early 2010s, after the Great Recession, Dr. Joe Webb, former director of WhatTheyThink’s Economics and Research Center, used to track what he called “recovery indicators,” six macroeconomic data points that, when they all started moving in lockstep in a positive direction, indicated that the recession would be “officially” over. Those indicators were the NASDAQ, ISM non-manufacturing new orders and imports, ISM manufacturing new orders and imports, and proprietors’ income.*
In a somewhat similar way, Calculated Risk (https://www.calculatedriskblog.com/), my favorite economics blog, has been tracking the COVID-19 recovery via “Seven High Frequency Indicators for the Economy” (https://bit.ly/2O1Icro). Given that the pandemic has not affected all areas of the economy equally, tracking the rebound in certain sectors—many of which are the printing industry’s top verticals—can give us a sense of how we’re doing. The sectors predominantly comprise travel and entertainment, and they are:
- Air travel, via the Transportation Security Administration’s travel numbers
- Restaurant dining via a “Seven-day average of the year-over-year change in diners as tabulated by OpenTable for the U.S. and several selected cities”
- Movies via domestic box office figures from BoxOffice Mojo
- Hotel occupancy rate week over week from STR/HotelNewsNow
- Gasoline supplied via U.S. Energy Information Administration (EIA)
- Transit From Apple: “This data is generated by counting the number of requests made to Apple Maps for directions in select countries/regions, sub-regions, and cities.”
- New York City subway usage from the MTA’s public turnstile data.
While they are not perfect (Bill McBride, who writes the CR blog, adds specific caveats for each data source) and are not updated on the same schedule and thus don’t correspond to the same weeks, these data points do indicate the extent to which people are increasingly (or decreasingly) out and about. McBride updates these each week, and we have started periodically checking in with these items in our Friday Data Analysis at whattheythink.com. For now, though, it’s worth clicking through to the original (the latest as of this writing is at https://bit.ly/38biHe3—there are charts galore and links to the original data sources.
As vaccinations continue, it will be interesting to see what impact they have on these various data points and if we are indeed seeing a rebound in some of the sectors most acutely affected by the pandemic.
* They never did indicate that the recession was over, even by 2016, so we’re not sure** if the problem was the economy and the recession never did end, or if the choice of indicators was a bit flawed.
** We’re pretty sure…